Intro
If there were a beginner’s guide to venture capital, the first page would have a caricature of Peter Thiel reciting the phrase “we don't live in a normal world, we live under a power law.” Simply put, outlier returns, while less frequent, are all that matter.
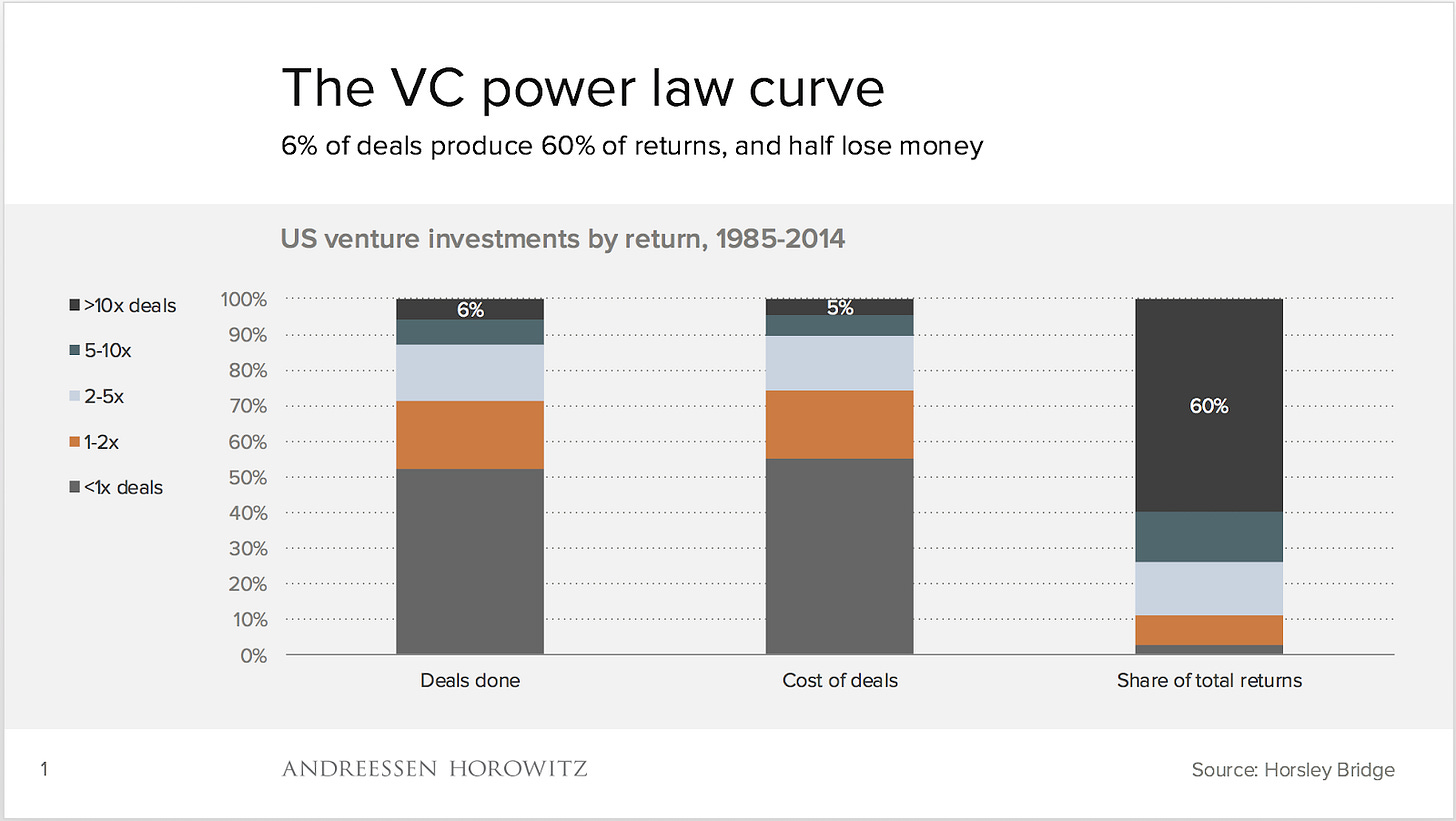
This power law observation is akin to a fundamental truth in the VC asset class. It underscores that a vast majority of the industry's returns come from a minuscule fraction of all deals. Need numbers? Data from a16z/Horsley Bridge lays it out: a mere 6% of deals are responsible for a dominant 60% of returns.
Despite consistent data underscoring the persistence of the power law in venture capital, many VCs strayed from this guiding principle in the early 2020s. All the while, LPs continued to endorse them. Why did they do this? Below, I will lay out what changed in the last few years and why LPs continued to support VCs' choices. Then, I will introduce a new metric for LPs to add to their toolbox that will provide a new perspective when they are evaluating managers.
The Midas Mirage
The first half of 2020 saw VCs crushed by a wave of companies hitting the COVID brick wall. In their despair they whispered a collective prayer for a reprieve. Little did they know that the ears of central bankers and governments would hear their request. With money being printed at a historic high, and quantitative easing, public markets and some other tangible assets would rebound stronger than ever. Suddenly, investors had the ability to turn any company they touched into a unicorn from the comfort of their home office.
The pandemic landscape seemed to obscure the established principles of the power law in venture. To investors it seemed every investment had the potential to return a fund many times over, which I will explore below. In hindsight the madness should have been evident. Investors were deploying as if future returns in venture would be normally distributed. This deviation from the norm should have served as a stark red flag that the industry's bearings had shifted.
Valuation Mismatch
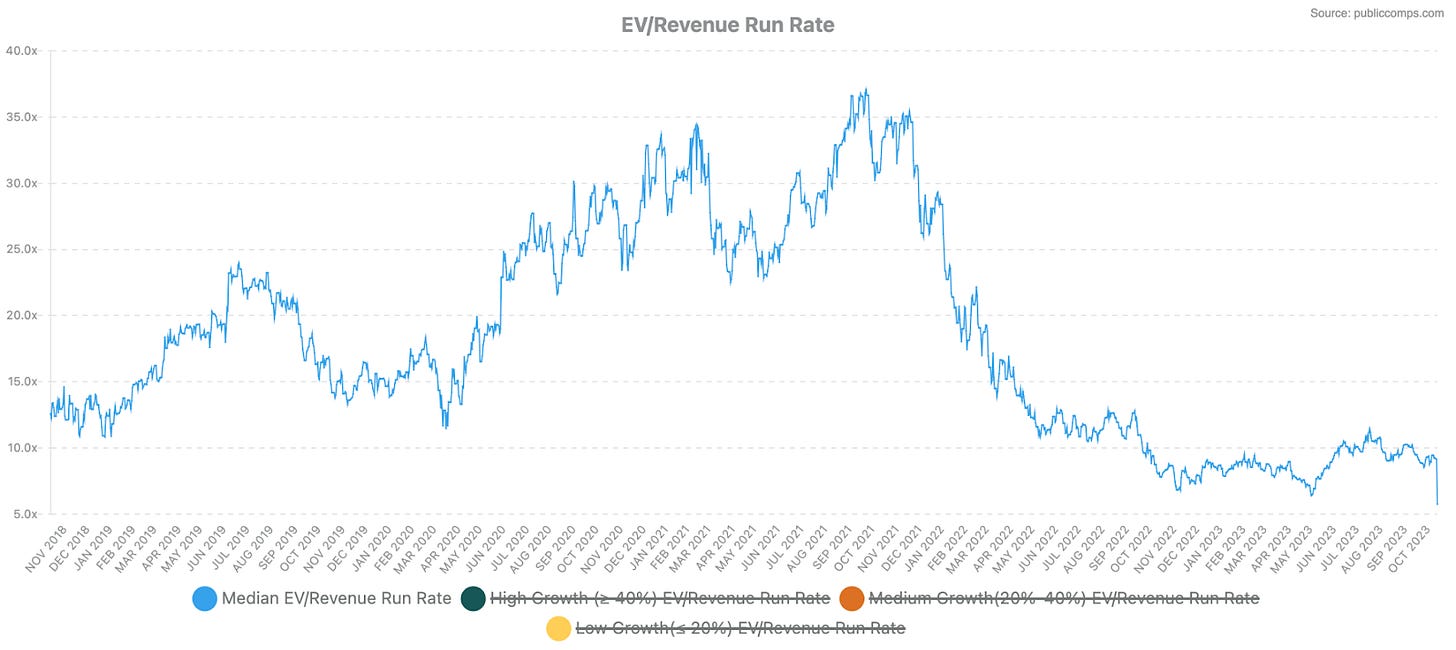
One of the catalysts for the "Midas Mirage" lies in the tendency of private market investors to lean on public company comparisons for current deal valuations. This practice seems incongruous, especially when considering the illiquid nature of these investments, which typically remain so for half a decade or even longer. During 2020 and 2021, public software companies had valuations that ranged between 25 to 50 times their Annual Recurring Revenue (ARR). Certain outliers, such as Snowflake, even exceeded this range, boasting valuations that surpassed 100 times their ARR.1
In an environment where public companies sported such inflated multiples, investors, enticed by prospects of accelerated growth, liberally valued private companies. It soon became the norm for even average software companies to be valued at 100x ARR multiples. Some achieved even more jaw-dropping valuations, in the vicinity of 300-400 times their ARR. A monstrous uptick to the 15-30x ARR multiples that were common in the back half of the 2010s.
Free Money
Unlike central bankers and governments, venture capitalists lack the ability to print money. They have to raise capital from limited partners (LPs) who can range from high net worth individuals to university endowments and pension funds. With interest rates at near-zero and LPs in search of alpha, capital began to flow to VCs at a record pace. Their faith was evident through the substantial influx of capital into US venture firms in both 2021 and 2022. Each of these years saw commitments surpassing $170 billion, resulting in a combined investment that exceeded the sum of the investments made in the preceding eight years.
In particular, LPs invested the bulk of their commitments in funds over $500M in size. In 2021, 54% of all commitments went to funds in this range and in 2022, this increased to over 63%. To underscore this shift, the capital directed to funds above $500M in 2022 exceeded the total investments across all venture funds in any single year prior to 2021.2
The justification for this was two fold (1) fixed income assets were providing historically low returns (2) returns in venture had never been better—VCs had markups on markups. More importantly they were returning record amounts of money as well. Between 2019-2021 VCs returned well over $1 trillion to LPs with the majority coming in 2021.
The trouble was these exits were based on checks written seven to ten years prior when the fund sizes were considerably smaller and the deal terms were more favourable. However, the breaks were about to be slammed in mid-2022 as the Federal Reserve initiated its cycle of rate hikes and quantitative tightening.
This sudden drop in public markets meant most LPs were overexposed due to the denominator effect. This meant LPs saw their public positions plummeted in value, they had more cost basis in venture capital than ever before. Using the same cohort of companies as before, median EV/ARR fell from 35x at its peak in Q4 2021 to below 10x by the end of Q4 2022.
Better Forecasting
No baseball manager plans their season around a player hitting a grand slam every other game. No golfer tries to win The Open by hitting a hole in one on every hole. Why not? Well it is obvious the occurrence of these events is low. Building a strategy around them occurring at a historically high frequency would be a fool's errand. Why did LPs not realise what happened in 2020 and 2021 was a mirage? The venture equivalent of baseball’s steroid era.
I posit it comes down to LPs not being able to utilise a metric that can be tied more closely to the odds of an outcome. One typical approach of sizing up a manager is to analyse their fund model. This usually breaks down to the expected ownership a VC aims for and the expected outcomes on their investments at exit. These inputs alone do not provide a full picture of what is required to return a fund—especially with the increased concentration of LP capital in larger funds.
Introducing the Tail Ratio
I propose LPs focus on a metric I call the Tail Ratio.
If venture lives under the power law then LPs should pay more attention to how high of a tail ratio is required to return a fund. The reason for this is the higher the tail ratio, the more improbable an outcome is to occur. This makes sense because the further towards the right you go on a power law distribution, the lower the frequency of an event.
The tail ratio offers a succinct metric for understanding the return dynamics of a venture capital firm. It serves as a standard for benchmarking fund managers across varying fund sizes. This standardisation is pivotal because conventional fund models based on ownership percentages tend to be less indicative, especially as the size of the fund swells. Consider a scenario where a $1B fund leading a $10M Series A would require a 100x tail ratio to return the fund. It doesn’t matter if they own 10% or 25% of the company. They still need the price per share to increase 100x to return the fund—a low probability outcome.
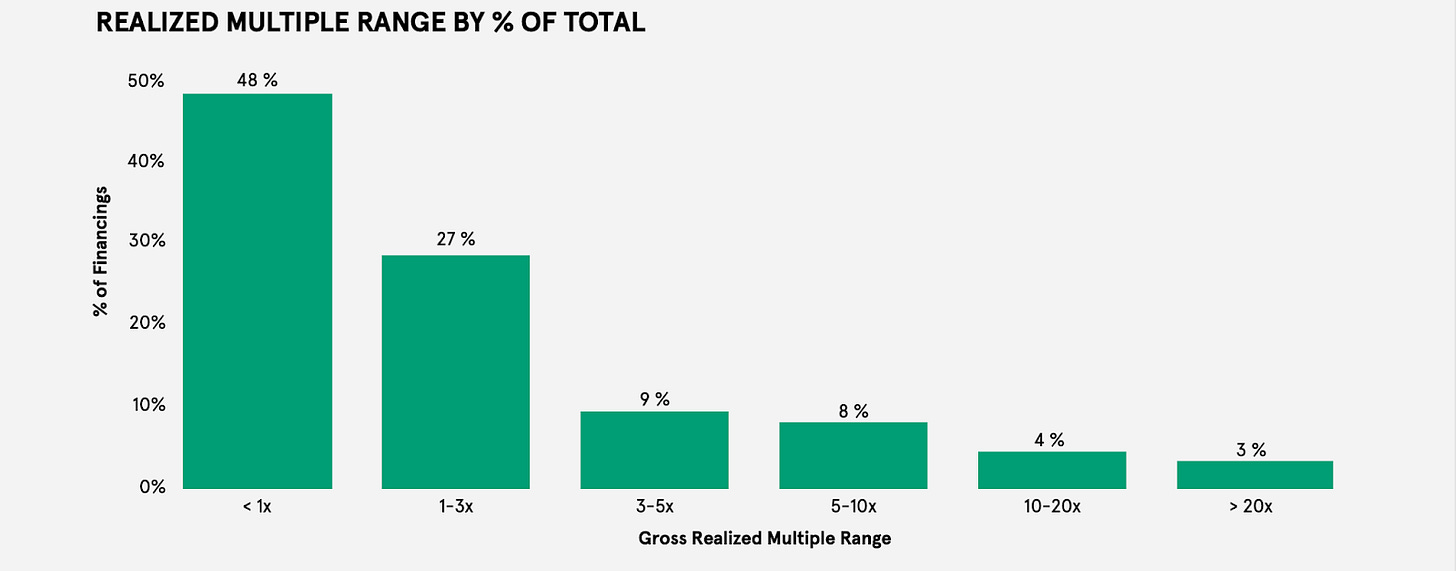
The data from Correlation Ventures reinforces this challenge: only 3% of financings attain or exceed 20x returns.3 Another study indicates a mere 0.4% of financings achieve returns north of 50x.4
Fund Tail Ratio
Applying the tail ratio to individual investments is useful but does not take into account the management fees and fund expenses that are incurred in the life of a venture fund. To solve for this I have adapted the tail ratio and so it can be applied across a fund.
The fund tail ratio is defined as the average multiple required to return a fund net of management fees and fund expenses. To find the fund tail ratio you need to calculate the weighted average by taking the tail ratio for each investment and multiplying it by its weight. This number is then divided by the sum of the weights multiplied by one minus management fees (as a percentage of the fund) and fund expenses (as a percentage of the fund).
To help exemplify this see the following mock fund:
The fund tail ratio offers LPs a valuable metric to assess what's required to return a fund. A higher ratio indicates that it's less likely for the manager to return the fund on any given investment based on their fund model. So, just how unlikely is it? Let's delve into some of the top-performing recent investments to get a clearer picture.
Venture Is A Grand Slam Business
Is it? There are 4,860 games in the MLB season with 127 grand slams in the 2023 season. This means as a baseball fan you have a 2.6% of seeing a grand slam at a given regular season game. This is 6x higher than the probability of a 50x return in venture capital.
What is more, our preliminary review of tail ratios for companies that went public recently shows just how hard it is to return a fund.5
The difference between a good investment in venture capital is not a difference in tail ratio. It is the fact the underlying company is able to hit a scale to where it hits or eclipses the tail ratio. For every Datadog there were dozens of dogs—investments that fell short of their tail ratio. The challenge is if the tail ratio increases industry wide it means a decrease in industry returns.
With the rapid growth of venture capital as an asset class over the last decade the question LPs should ask is, are there enough outlier companies to return the funds they invest in? While that was the narrative in venture from 2017-2022 I would argue there are not. It seems unlikely the public markets have room for the 1,200 private unicorns around the world. Just look at the data.
A quick pull of publicly traded technology companies (globally) shows there are only 309 companies with a market cap over $4B. That number more than halves to 147 at $15B and 60 at $50B.6 The Series A investors behind Gitlab, Samsara, and Airbnb needed $16B, $25B, and $34B outcomes to return the funds those checks were written out of. In other words, they had to be outliers among outliers to be fund returning outcomes.
An Application Of The Tail Ratio - Fund Returning Valuation (FRV)
In venture there are very few companies that go on to be SpaceX or Meta. We can utilise the tail ratio to calculate a forecast of the valuation needed from a given investment to return the fund.
For example, if you invest at $40M post, have a tail ratio of 50, and expected dilution of 60%, our FRV would be $5B. While an investment with the same parameters but a tail ratio of 90 would mean a FRV of $9B. The difference here being driven by either smaller check size between the two examples or a larger fund size in the latter example. Irrespectively, the difference in tail ratio shows to return the fund you need to be able to underwrite to a $9B vs. $5B outcome.
This can also be applied to a fund where you replace the entry valuation for a deal with the average entry valuation across a fund. The ideal outcome here being a manager has as low of a FRV as possible as that increases the probability of returning a fund. This is because outcomes become more likely the lower the FRV.
Closing Thoughts - What If LPs Adopt The Tail Ratio?
The tail ratio is a straightforward metric influenced by two variables: fund size and concentration of investment dollars. Over the last decade, and especially in the last three years, we have witnessed fund sizes skyrocket.
If LPs begin to use the tail ratio as an additional tool in their evaluation of managers, I anticipate:
LPs would become more sceptical about committing to managers whose fund sizes have dramatically increased. Intuitively, funds exceeding $500M should be subjected to more scrutiny. Only a handful of firms have demonstrated the capability to deploy such vast sums effectively.
Individual LPs might establish specific tail ratio thresholds beyond which they're unwilling to commit. For instance, a fund with a tail ratio exceeding 100 might not attract certain LPs who favour more concentrated deployment models.
Should the number of funds over $500M diminish, I would expect to see a decrease in valuations, particularly in the late stage. This would reduce the FRV, increasing the likelihood that a particular investment could return a given fund.
With more limited growth-stage capital, companies would either:
Look for strategic exits sooner without inflating their pref stack to the point where returns for all shareholders see diminishing returns.
Pursue public listings earlier than is currently common. In my view, this would be a positive shift, as very few companies genuinely benefit from remaining private for multiple decades.
I will release a follow up post next month on historical and future tail ratios next month. In the interim I would appreciate any feedback LPs have. Feel free to send it to me directly on gajri@originalcapital.com.
Thanks to Charlie Aaronson, Aman Gajri, Dawn Gajri, Tejinder Gill, Jon Ma, Reed McBride, James McGillicuddy, Kais Khimji, Ryan Snow, Davis Thacker, Rose Wang, Brent Westbrook, and Amar Verma.
Data from PublicComps for September 30, 2020.
Pitchbook Funds Overview.
https://medium.com/correlation-ventures/venture-capital-were-still-not-normal-9d07d354db88
https://www.sethlevine.com/archives/2014/08/venture-outcomes-are-even-more-skewed-than-you-think.html
The tail ratio is calculated based on the respective fund size from which the investment was made. I estimated the investment size based on what I could learn from the S-1.
https://companiesmarketcap.com/tech/largest-tech-companies-by-market-cap/ as of October 12, 2023.


